While summer months are expected to produce higher numbers of motor vehicle collisions, this isn’t entirely the case in West Virginia.
In 2018 and 2019, October saw the highest number of collisions compared to any other month of year, including August—often recognized as one of the most dangerous months on the road.
Based on crash data provided by the West Virginia Division of Highways, October had over 700 more collisions than August, the second-highest month.
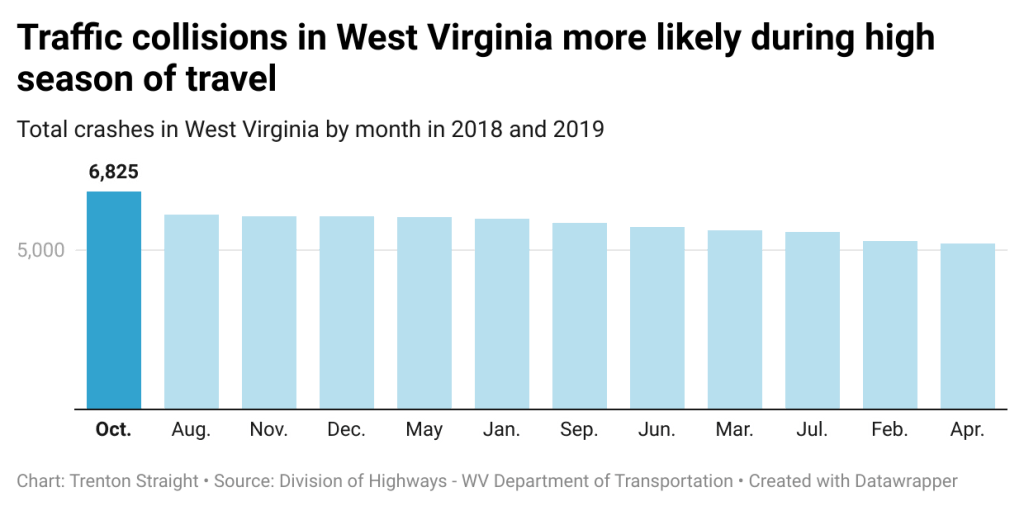
With the exception of October, months experiencing high traffic volume yielded more traffic collisions in West Virginia than those less traveled.
Based on this trend, crashes in state are more likely to occur during months with high travel like August when the bulk of summer travelers are returning from vacation.
Holidays traditionally produce higher traffic volume as well, which may suggest why November and December experienced a higher numbers of crashes—the Sunday after Thanksgiving is one the busiest travel days of the year.
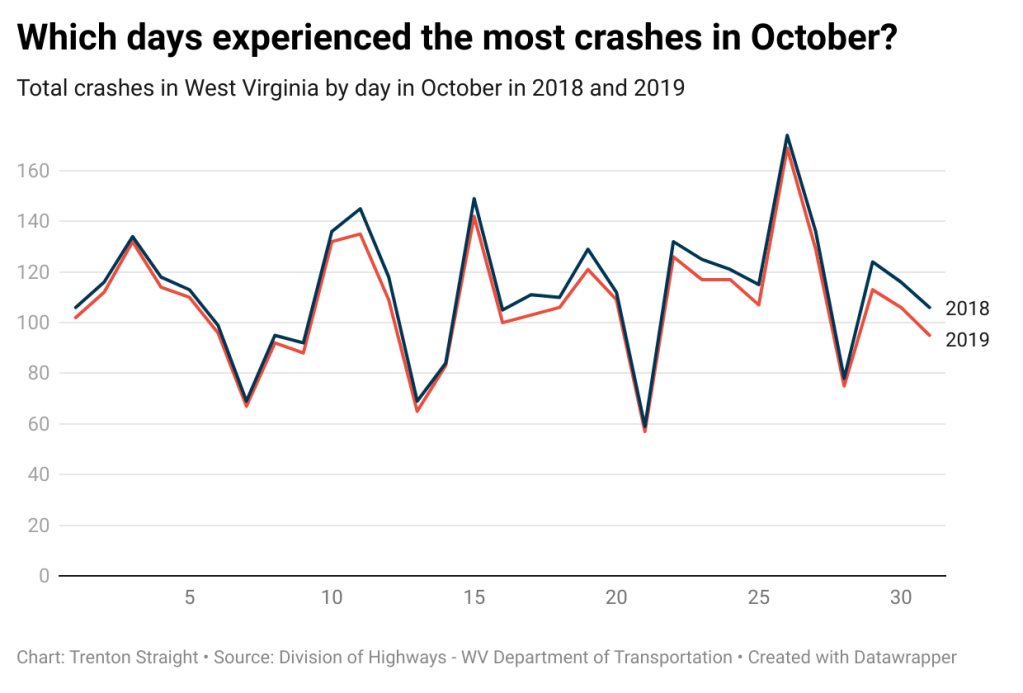
When comparing the month of October for both years, the number of collisions per day followed a similar trend. In both years, Oct. 26 experienced the highest number of traffic collisions before seeing a sharp decline in the remainder of the month.
Multi-car collisions follow similar trend
In addition to having the most crashes out of any given month of the year, October had the most drivers involved in collisions, based on driver data provided by the West Virginia Division of Highways.
For the most part, multi-car collisions followed a similar trend to total collisions, meaning months experiencing higher numbers of collisions are also likely to see an increase in the number of drivers involved in those collisions.
But while April saw the lowest number of total collisions in both years, February had the lowest number drivers involved in collisions.
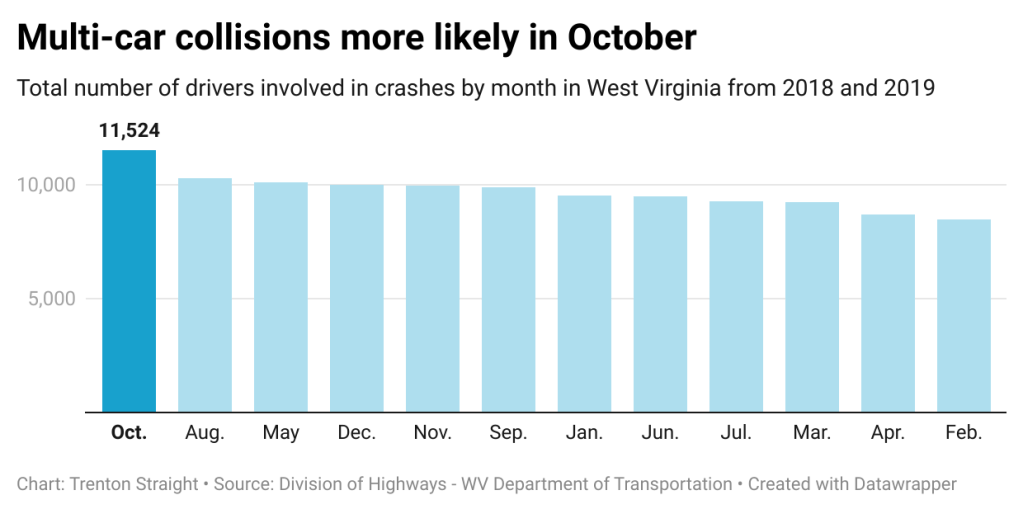
Again, October yields unusual results. Not only are crashes more likely in October, based on the data, the month is likely to have a higher number of drivers involved in those accidents.
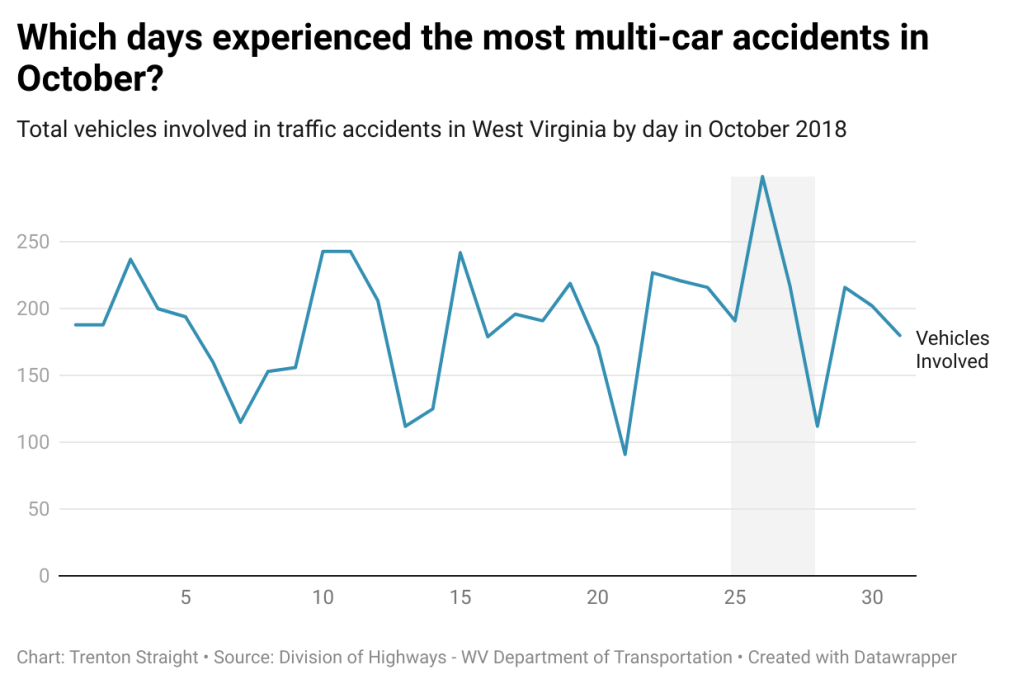
When considering the month of October as a whole, the trend between the total number of collisions per day is almost identical to the number of multi-car collisions by day in 2018, the year with the higher number of collisions.
Once again, at 299 drivers, Oct. 26 experienced peak numbers compared to other days.
How do out-of-state drivers factor in?
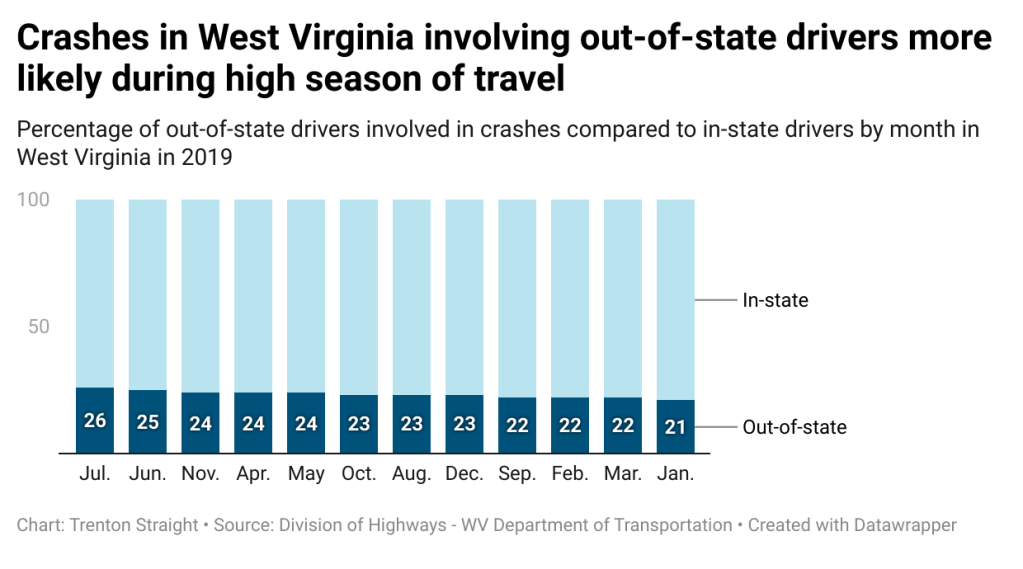
When comparing in-state and out-of-state drivers in West Virginia in 2019, the summer months saw an increase in collisions involving out-of-state drivers.
Based on the numbers from 2019, West Virginians can expect a higher proportion of out-of-state drivers in June and July. Over a quarter of drivers involved in collisions in July alone were from out of state.
As expected, in-state drivers still make up a vast majority of traffic collisions throughout the year, while those from out of state make up less than a quarter of those collisions. This is likely due to the higher proportion of in-state drivers on the road compared to out-of-state drivers at any given time in West Virginia.
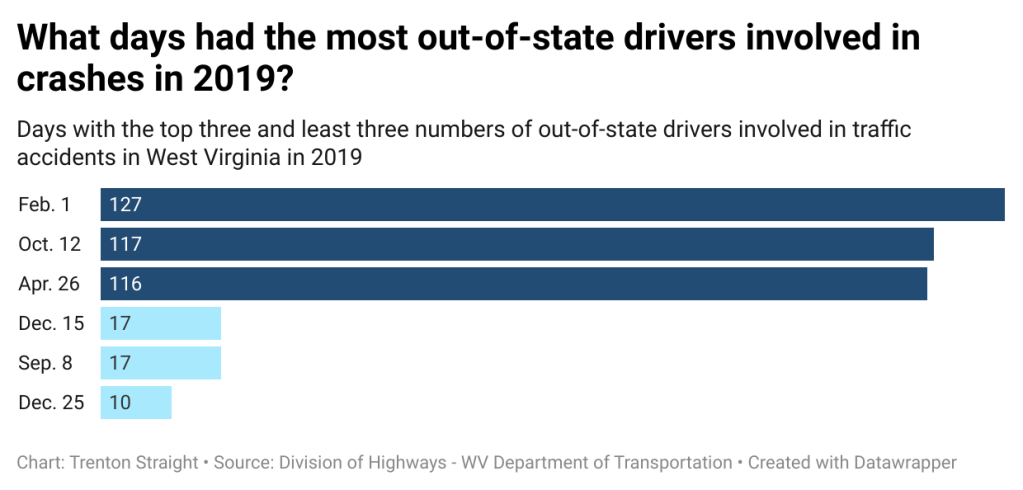
While February had the least amount of drivers involved in crashes, Feb. 1 saw the highest number of out-of-drivers compared to any other day in 2019. Christmas day, on the other hand, experienced the lowest number of out-of-state drivers in crashes.
When looking at the data, it seems that traffic collisions in West Virginia are more likely to occur during months of high travel, particularly October. West Virginia residents can expect a similar trend in the coming years.
Methods
All data was collected from the Traffic Engineering Division of the West Virginia Department of Highways on March 22, 2021. The data set contains two tables—one containing drivers and one containing crashes—for both 2018 and 2019.
Pivot tables and string functions were used to determine the number of crashes by month and by day.
To determine whether out-of-state drivers or in-state drivers were involved in crashes, the IF function was used to test the truth value of the statement “WV.” The issuing state for each driver was provided in the given data. From there, the percentage of out-of-state drivers compared to in-state drivers was calculated.